Old slowness
If you have used KGet you might have noticed that KGet tends to be very slow, or rather sluggish if you have many items in your transferlist. For one it can take very long to start, then long for an operation you want to do and again long to remove many transfers.
I have used callgrind before to track the issues down. Though it turned out that the callgrind output was so confusing — even combined with KCachegrind — that it was hard to find the parts that were of interest for a certain task I wanted to look at.
Efficiently using Callgrind
Now triggered by Jonathan’s blog post (and the followup) on speeding up KRatingPointer via finding bottlenecks through callgrind I did the same again for KGet. But this time I used more sophisticated methods that really make it shine, an easy introduction can be found here.
The idea is that I define the places that should be profiled in KGet itself via some macros (CALLGRIND_START_INSTRUMENTATION; and CALLGRIND_STOP_INSTRUMENTATION; from #include <valgrind/callgrind>). That way only what I want is being profiled and I don’t get profiling information for areas I don’t want. The later part is really important since otherwise the result would be completely distorted (e.g. because of the starting KGet phase etc.). Now I only need to start callgrind with valgrind --tool=callgrind --instr-atstart=no kget --nofork and I get some useful dumps.
Example
So what does using callgrind look like?
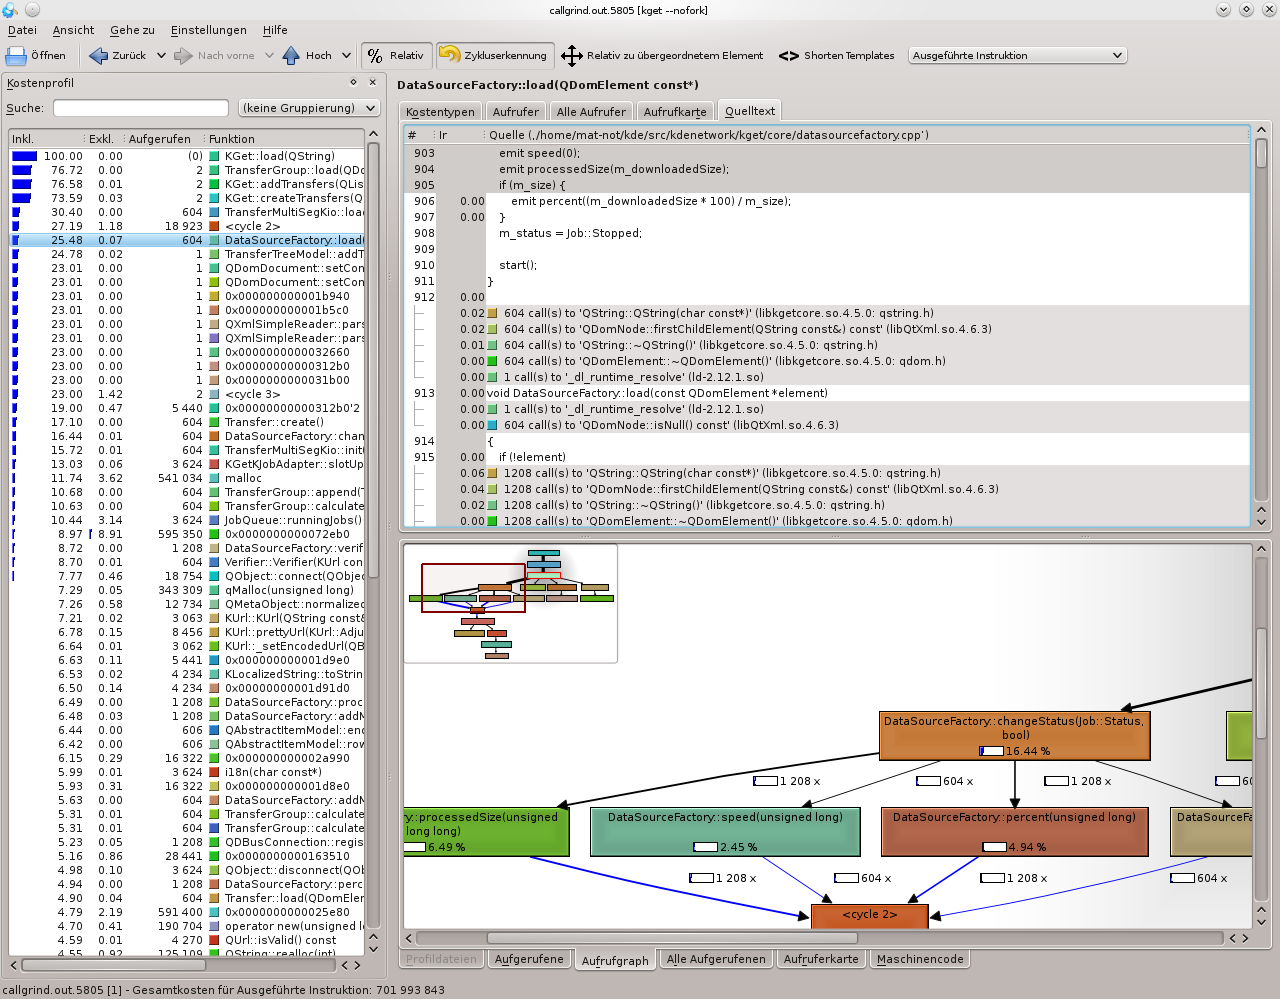
I wanted to know what takes long when starting KGet, in specific loading all Transfers. So I added the above mentioned macros to KGet::load(…) at the beginning of the method and at the end. Then running callgrind and then kcachegrind on the data generated something like you can see in the screenshot (sorry for the German).

As you see loading 604 Transfers was quite expensive and most of the cycles happened in TransferTreeModel::addTransfer and there what took so much time was QStandardItem::appendRow — or rather the actions caused by the signals emitted by appendRow. What I did to improve this was adding a TransferTreeModel::addTransfers to add all the transfers at once. I did it a little hacky, i.e. I start a beginInsertRows then deactivate emitting signals for the model as those resulted in constant redrawing of the view connected to the model, then call appendRow multiple times, reactivate the signals again and do a endInsertRows. I only did that hacky way because I did not manage to use QStandardItem::insertRows, it appears not to be what I need.
Those measurs alone resulted in a huge speedup. Once done even more I got something like this:
As you can see the total cost decreased drastically and a lot of time is spend in parsing xml-data. Still there are areas left that can be improved easily. DataSourceFactory::setStatus takes 16% of all cycles — 99% because of signals — taking a closer look one can see that both DataSourceFactory::processedSize and DataSourceFactory::percent are emited 1208 times while the rest is emited 604 times. That means that for each Transfer those two are emitted twice. Emitting them just once gave a 5% speedup, more would be possible by emitting just one signal something like changeEvent(Tc_Status | Tc_Speed | Tc_TotalSize | Tc_Downloadedsize), so not having a signal for each event but rather defining in the send data what changed.
Result
All this lead to many speed improvments in KGet. KGet should now (4.5.2) be a lot faster in the startup process, when scrolling and significantly faster when removing many transfers. I will look into speeding up starting/stopping many transfers too.
Before I go into any details remember that all that was tested on my machine so the results may vary on yours. Also keep in mind that faster here means less cycles, so that does not translate 1:1 in real time, as io operations — Callgrind does not help here — could use few cycles yet still take a lot of time as a HD is very slow compared with other memory. An example for this is the SQlite history backend that, looking at the cycles, only improved marginally (~20%) while the time when deleting ~600 downloads — all those get added to the store — shrank from 51942 msec to 138 msec.
Especially removing transfers got a lot faster. When removing many unfinished transfers it can now be more than 170 times faster than before, also removing finished transfers can be around 85 times faster. In the last case the speedup depends on if the removed transfers are neighbours, i.e. there are no transfers inbetween them, in the worst case it should still be a little faster. At the same time starting KGet with ~600 downloads was improved 35 times.
In fact there are still a lot of areas for further improvement, though I am quite happy with the result already.
So thank you Callgrind devs, Jonathan for your blog entry and especially Kyle Fransham for his great tutorial which should be put on techbase imo! And in fact all others who helped me deserve a thank you was well. 🙂
PS.: No this is not the large feature I was talking about last time, haven’t worked on that for a while. This is rather like bug fixing. 😉

September 11, 2010 at 4:41 pm |
Hey, I have no experience with Qt just Gtk+/Gtkmm and I discovered your post by accident. I read the section regarding the TreeView and it reminded me of something I read on the Gtk mailing lists(maybe it was in the gtkmm’s mailing list, I can’t remember).
Some people had speed problems with updating large GtkTreeViews. I assume that the Qt TreeView works in a similar way. One way to speed up the process was to remove the associated TreeModel from the TreeView, do all the necessary edits on the TreeModel’s data and then re-associate it with the TreeView. You can try this method too, instead of blocking the signals.
September 12, 2010 at 9:19 am |
Yes I guess this would work too, though imo is less object oriented as in general the model should not care what is connected to it or not. The blocking of the signals works directly in the model, so for the assigned views it works just normal.
September 11, 2010 at 5:17 pm |
awesome! as always, thanks for making KGet better!
September 11, 2010 at 5:38 pm |
Thank
September 11, 2010 at 8:24 pm |
Which optimization level did you use when using callgrind?
With -O0 there is no inlining, so all functions are listed, but the results could probably be wrong, because there are normally huge optimizations, maybe an inner loop could be much faster because of some inlining+constant-folding etc.
What is your usual approach?
September 12, 2010 at 9:17 am |
Using -O2 flags, though in my case it would not have changed much. The really expensive part could not be optimized away by the compiler.
September 13, 2010 at 8:52 am
I see on the first screenshot that there is a call to KDebug::hasNullOutputQtDebugMsg that should have been inline.
(btw, the shown source code does not seem to be the same as the one that has been profiled.)
September 11, 2010 at 11:07 pm |
Matthias, you talked to me on IRC the other day about callgrinding KIconLoader and I think I’ve found the issue you were referring to. Should be fixed in 4.6, and I’ll likely backport to 4.5.2 as well.
September 12, 2010 at 9:22 am |
That is great! 🙂
September 13, 2010 at 9:14 am |
@Gof Yes the source code refers to newer one, i.e. I just opened the old cachegrind file to make a screenshot for the post. 😉
Ah true, good catch, sometimes I compiled it in debug mode not release mode — was doing multiple things at once — might explain the lack of inlining.